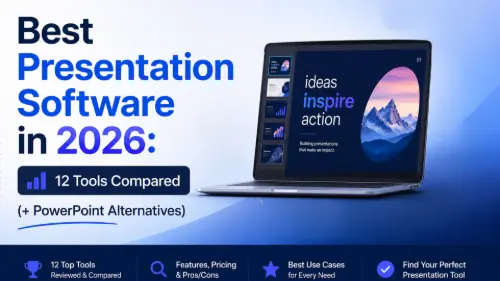
Most presentations look the same — default fonts, bullet-point walls, stock photos from 2015. Making your slides look good doesn't require design skills. It requires knowing a few rules, the right tools, and where to find visuals for presentations. This guide shows you how to make slides look good in PowerPoint and Google Slides, how to create visual presentations, and the best AI and pitch deck tools to do the heavy lifting for you.

- The #1 rule: less text, more visuals. If a slide has more than 6 lines, it needs a redesign.
- Best AI to make your PowerPoint look better: Gamma.com.ai (generates designed decks), Beautiful.ai (auto-formatting), Canva (templates).
- Below: 10 design rules, visual resources, and AI tools compared.
10 Rules to Make Slides Look Good
| # | Rule | How to apply it |
|---|---|---|
| 1 | One idea per slide | If a slide makes two points, split it. Your audience processes one thing at a time. |
| 2 | 6 words or fewer in the title | Titles are headlines, not sentences. "Revenue grew 23%" beats "Our revenue performance in Q3 showed growth." |
| 3 | Max 6 lines of body text | If you need more, you're writing a document, not a slide. Cut ruthlessly. |
| 4 | Use one font family | Pick one sans-serif font (Inter, Helvetica, Montserrat). Use weight (bold, regular, light) for hierarchy instead of switching fonts. |
| 5 | 3 colors maximum | One primary, one secondary, one accent. Use a palette generator (Coolors.co) if needed. |
| 6 | Full-bleed images | Stretch high-quality photos to the full slide. Add a semi-transparent overlay for text readability. |
| 7 | White space is your friend | Don't fill every inch. Empty space makes content easier to scan and looks more professional. |
| 8 | Align everything | Use PowerPoint's/Google Slides' alignment guides. Misaligned elements are the #1 sign of an amateur deck. |
| 9 | Charts over tables | A bar chart communicates faster than a table of numbers. Save tables for handouts. |
| 10 | No clip art, ever | Use icons (Flaticon, Feather Icons), photos (Unsplash, Pexels), or simple shapes instead. |

How to Create Visuals for Presentations
The best visual presentations replace text with images, charts, icons, and diagrams. Here's where to find them:
| Visual type | Best free sources | When to use |
|---|---|---|
| Photos | Unsplash, Pexels, Pixabay — all free, high quality, no watermarks. | Full-bleed backgrounds, product shots, team photos, mood-setting imagery. |
| Icons | Flaticon, Feather Icons, Heroicons — thousands of consistent, clean icons. | Replacing bullet points, illustrating features, process steps. |
| Charts & graphs | Built into PowerPoint/Google Slides, or use Datawrapper for web-ready charts. | Any time you're showing numbers, trends, or comparisons. |
| Diagrams & flowcharts | Built into slides (SmartArt in PPT, Diagrams in Google Slides), or Miro/FigJam. | Processes, org charts, timelines, system architecture. |
| Mockups | Canva, Smartmockups, MockupWorld — show your product on a device or in context. | Product demos, app screenshots, website previews. |
| AI-generated images | Canva (AI image generator), DALL-E, Midjourney. | Custom illustrations, conceptual visuals, when stock photos don't fit. |
Visual Presentation Examples
Here are visual presentation examples that show these principles in action:
- Full-bleed photo + one line of text: a stunning landscape photo covering the entire slide, with a single sentence in white text overlaid. Used for title slides, section dividers, or emotional impact.
- Icon grid: 4–6 icons in a grid, each with a 2–3 word label. Replaces a bullet-point list of features or benefits.
- Big number + context: a huge number (e.g., "43%") centered on the slide, with one line of context below ("of users return within 7 days"). Data that punches.
- Before/after split: the slide divided in half — left shows the "before" state, right shows the "after." Great for showing impact or transformation.
- Timeline with icons: a horizontal timeline with 4–6 milestones, each represented by an icon and a date. Replaces a text-heavy history slide.
The "creative, eye-catching" look most people want comes from subtraction, not addition. Remove the bullet points, remove the extra text, remove the decorative borders — and what's left looks professional. Design is editing.
Best AI Tools to Make Presentations Look Better
| Tool | Free | What it does for your slides |
|---|---|---|
| Gamma.com.ai | ✅ | Generates a complete, professionally designed presentation from a topic or outline. AI handles layout, color, typography, and images. The fastest way to go from idea to polished deck. |
| Beautiful.ai | ❌ | Smart templates that auto-format as you add content. Elements snap into place, charts resize, and layouts adapt. You focus on content; the tool handles design. |
| Canva | ✅ | Thousands of designed templates. Drag-and-drop editor with AI image generation, background removal, and brand kit. Great for visual variety. |
| Microsoft Copilot | ❌ | AI inside PowerPoint. Generates slides, suggests layouts, creates images from prompts. Best for PowerPoint users who want AI without switching tools. |
| Slidebean | ❌ | AI-designed pitch decks. Paste your content, the AI formats it into investor-ready slides. Best pitch deck generator for startups. |
AI Pitch Deck Generators
If you're building a pitch deck, these pitch deck creators generate investor-ready slides:
- Gamma.com.ai: describe your startup, get a complete pitch deck with the right structure (problem → solution → market → traction → ask). Free tier available.
- Slidebean: specialized in startup pitch decks. AI formats your content into clean, professional slides. Paid.
- Canva: pitch deck templates with drag-and-drop customization. Free tier available.
- Beautiful.ai: smart pitch deck templates that auto-format. Paid.
💡 Pro tip: The fastest way to make any presentation look professional: use Gamma.com.ai to generate the design, then customize with your content and data. The AI handles typography, colors, layout, and images — you bring the substance. Result: a deck that looks like it took hours, built in minutes.
Conclusion
Making slides look good comes down to restraint: one idea per slide, one font, three colors, and visuals instead of text. Use free resources (Unsplash, Flaticon, Coolors) for high-quality visuals for presentations, and let AI tools (Gamma.com.ai, Beautiful.ai, Canva) handle the design if you're not confident doing it manually. A visual presentation with clean images and minimal text will always outperform a text-heavy deck with fancy animations.
FAQs
How do I make Google Slides look good?
Use one font family, 3 colors max, full-bleed images, and one idea per slide. Replace bullet-point lists with icons or charts. Use free templates from Slidesgo or SlidesCarnival. And leave white space — don't fill every inch.
What's the best AI to make a PowerPoint look better?
Gamma.com.ai generates a complete designed deck from scratch. Beautiful.ai auto-formats as you add content. Microsoft Copilot works inside PowerPoint itself. Canva offers designed templates with AI-assisted editing.
How do I create visuals for presentations?
Photos: Unsplash, Pexels (free, high-quality). Icons: Flaticon, Feather Icons. Charts: built into PowerPoint/Google Slides. Diagrams: SmartArt (PPT) or draw with shapes. Mockups: Canva, Smartmockups. AI images: Canva AI, DALL-E.
What is a visual presentation?
A presentation that communicates primarily through images, charts, diagrams, and minimal text — rather than text-heavy bullet-point slides. Visual presentations are easier to follow, more memorable, and more engaging.
What's the best AI pitch deck generator?
Gamma.com.ai (free, generates complete pitch decks with the right structure), Slidebean (specialized in startup decks, paid), and Canva (templates with AI features, free tier). Describe your startup and the AI handles structure and design.